We don't guess the market.
We model it.
This is what the model is evaluating right now. Markets and betting, the same system, unfiltered.
Every pick settles and stays public. Hit or miss.
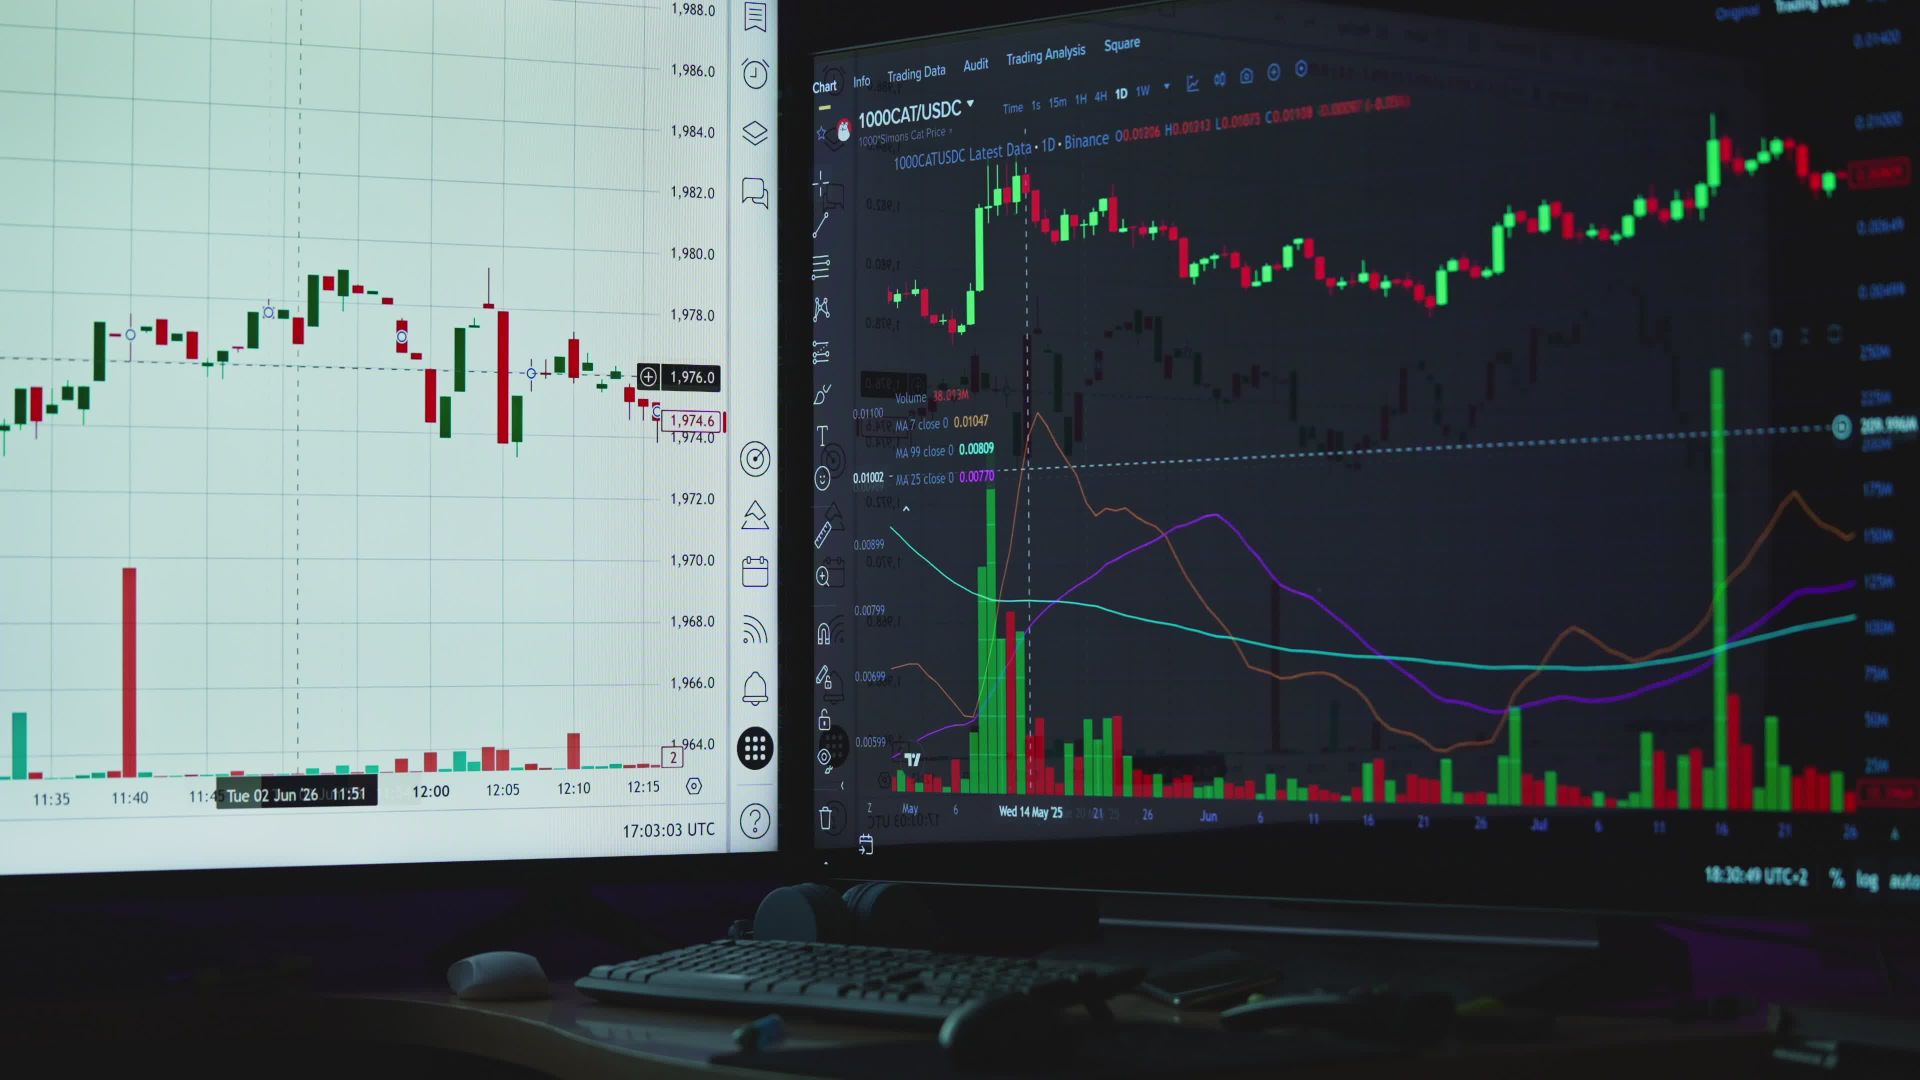
The same real chart our subscribers use — candles, returns by horizon, and compare. This is the public version, with a single sample symbol.
What the model evaluates, and how it gets to each number.
Click any row for the detail.
Medium and high risk, every day.
See morePre-open catalyst summary, a risk map by asset class (1 to 5), a real-time candlestick chart with returns by horizon, and alerts when your asset crosses the price you choose.
One large-cap stock, analyzed in depth, every morning.
See moreRelative valuation against its sector, the next catalyst, the thesis risk laid out unfiltered, and our own search tool with live candlestick charts, analyst consensus, and a personal watchlist for any real U.S. stock.
The real edge against the line, not just the pick.
See moreQualitative read (rotations, schedule, motivation) on top of the pure probability calculation.
Practice with 100% fictitious money.
See moreSHARP Trader (6 modules), the Betting Academy, and the SHARP Academy, included from the Basic plan.
Before 6:00 AM, every day.
HowPublic and paid sources, never a single provider. They're cross-checked against each other before entering the model.
Our own code. Not a language model.
HowProbability and edge come from verifiable formulas, the same ones every day.
A real analyst reviews every signal.
HowA person checks the model's output against what actually happened that week, before it's published.
Only if it clears the threshold. We don't share which one.
HowEvery day, more gets discarded than published — the exact threshold is deliberately never disclosed.
This is what a briefing looks like.
Real pieces of the format subscribers receive every morning.
Dogecoin: bullish momentum holds despite the post-rally pause
Technical momentum, the 30-day range, and why Bitcoin's leadership is the variable to watch to read the rest of the crypto market.
The data. Price sits at $0.09943, within its 30-day range ($0.08008 to $0.10044), with momentum of +2.36% between its short and long moving averages. Volatility is flagged as high.
The read. Dogecoin led the crypto market's recent rally, with a reported double-digit jump just a couple of sessions ago, and is easing back slightly today in a natural pause after that move, without losing the bullish momentum.
The risk. This is a technical signal, not a prediction of exact direction, and high volatility means these pullbacks can be as fast as the rally that preceded them. Worth watching whether Bitcoin holds its levels, since Dogecoin tends to move on that leadership.

 MLB: Totals, the model's newest market, with the ballpark's real park factor
The model crosses both teams' expected runs with the home ballpark's real park factor (Baseball Savant) against the market's Over/Under line.
The data. Toronto visiting Baltimore: the model calculates 10.6 expected runs at this ballpark (park factor 104, slightly hitter-friendly), against a real market line of 7.5.
The read. The gap between the expectation (10.6) and the line (7.5) is wide — the ballpark's real park factor, not just the teams' offenses, is what moves this number.
The edge. Signal validated against 2,280 real games from the season before connecting it to the live model. It's not a certainty: it's positive expected value, meant to play out over many repetitions.
 Paychex: solid growth on the very day it reports earnings
We cross real growth, profitability, and analyst consensus against the uncertainty of a quarterly report landing that same day.
The data. Revenue growth of 16.88% year-over-year, net margin of 27.03%, and ROE of 45.13%. Trades at 23.27 times earnings and reports quarterly results the same day as this example.
The read. Paychex heads into its report with strong momentum per recent media coverage, and its growth and efficiency fundamentals are solid. There's no reference P/E for the payroll/HR sector to compare the multiple directly, so it reads on its own, in the context of that growth.
The risk. Analyst consensus is split: 15 "hold," 4 "sell," and 3 "strong sell," versus only 2 "strong buy." Reporting earnings the same day exposes the stock to a binary short-term reaction. This is NOT a buy recommendation: it's a structured note for you to decide.

 Costco vs. Chevron: does it make sense to pay triple for every dollar of EBITDA?
We compare the EV/EBITDA multiple of two companies with nearly identical market caps, looking at when that gap reflects real certainty and when it's already an expensive premium.
The data. Costco trades at 27.96 times its EBITDA, with a market cap of $398,869 million. Chevron, with an almost identical cap ($399,916 million), trades at only 8.45 times its own.
The read. The market pays more than 3.3 times more for every dollar of EBITDA Costco generates than it pays for Chevron's, even though both companies are worth practically the same today. Against its 6 real industry comparables, Costco sits at the 100th percentile — the most expensive in its own group.
The question. It's not which company is better: it's whether that gap is justified by the stability of Costco's membership model versus an energy business more exposed to commodity price cycles, or whether it's already an expensive bet on safety.
 Aflac: a 10%+ shareholder sold $1.2M outside a scheduled plan
We track every Form 4 the SEC requires when an investor or executive buys or sells shares, and separate what's scheduled from what's sudden.
The data. Japan Post Holdings, owner of more than 10% of Aflac, sold 10,373 shares at $115.36 on September 21, without the cover of a pre-scheduled 10b5-1 plan. It kept 50,521,117 shares.
The read. Since it wasn't under a 10b5-1 plan, this sale doesn't carry the same "decided weeks in advance" cover that other sales in the same insider universe do. Even so, the size is minimal against what's left: barely 0.02% of the total position.
The context. We track a universe of tickers every day, straight from EDGAR, with no exceptions, and always separate what's scheduled from what's sudden so the real scale of the move is clear.
One plan for every level of involvement.
No annual contracts. Billed month to month — change plans or cancel whenever you want.
- Daily email briefing: medium/high-risk markets + S&P 500/Nasdaq stocks + sports
- Structured analysis of 3 different stocks every day: valuation, next catalyst, and thesis risk
- The week's suggested bets with medium confidence or higher (usually 5 to 10)
- Every suggestion marked with its confidence level: medium, medium-high, or high
- Risk map by asset class
- Your full briefing history in the web dashboard
- Included access to the SHARP Academy: "Trainee to Invest" course, 8 modules with quizzes
- SHARP Trader: advanced 6-module course with real cases (PEAD, insiders, valuation, bankroll management)
- Betting Academy: 5 modules on the real Elo model, markets, and bankroll management applied to betting
- SHARP Simulator: trade real FX pairs with 100% fictitious money, like a real broker
- Private Telegram channel: real-time alerts (IPOs, earnings surprises, picks) and a subscriber community
- Cancel anytime, no commitment
- Everything in Basic, plus:
- The model's full, unfiltered picture: every signal it evaluates each day, not just Basic's curated selection
- The complete breakdown behind every suggestion: the adjustments applied (starter, bullpen, injuries, home field…), the calculated probability, and the exact edge against the line
- The full qualitative reasoning behind every analysis
- Public record of the model's hits and misses
- U.S. stock screener: live price and fundamentals for any company trading on the NYSE or Nasdaq
- SHARP Simulator with real U.S. stocks in addition to FX (Basic trades FX only)
We provide statistical analysis and quantitative models on sports markets. We don't accept bets, don't handle user funds, and don't guarantee outcomes. Financial and entertainment decisions are the user's alone.
This is what the model looks like inside.
A simplified, optional example of how each analysis breaks down before it's published.
Based on net positioning, 30-day implied volatility, and correlation with the Chinese manufacturing index.
 Netflix (NFLX)

 Walmart vs. Exxon
 BNB Plus Corp. (BNBX)
The sports and markets analysis platform.
A proprietary model running every day across 4 sports and the markets. Dashboard, a verifiable record, an Academy. The briefing is just the notice that it's ready. Cancel anytime from that same email, no calls, no questions asked.
Before you subscribe.
Risk notice. SHARP's content, including medium/high-risk market analysis, structured S&P 500/Nasdaq stock analysis, and sports betting analysis, is informational and educational — it does not constitute personalized financial advice and does not guarantee outcomes. Any investment in financial instruments, including large-cap stocks, carries risk of loss, including total loss or loss exceeding the capital invested in higher-risk markets. Sports betting carries the risk of losing the full amount wagered and is intended exclusively for adults. If gambling stops being entertainment for you, seek help: a responsible gambling helpline is available in your country of residence.